Tuesday, June 25, 2024

Working with Geometries - GIS Programming Module 6

 Hello everyone,

In this week's final edition of the GIS Programming blog series, we explore "Working with Geometries". I am sad to see this class ending, but I have taken so much away from it, I can't wait to dive even deeper into programming with Python. Some learning outcomes we were expected to take away from this course include being able to create a search cursor to iterate over shapefile geometries, demonstrate the ability to write vertices of a geometry to a text file, and then contrast the different objects using parsing over geometries within a script. At this point of the course it seemed pretty straightforward, so here is the flow chart that breaks down the process to reach the outcome in the screenshot below the flow chart:


By successfully following this script in the flow chart, you should reach this outcome:


In order of the appearance in the results above, the first number is the object id, and the second is the vertex id which is increased by one each time until the end of a feature and starts again for the next feature. After the two ID values, what is displayed next are the XY coordinates in that order. Finally, what is listed after all of those fields is the name of the features which are stream names. Overall the code is pretty straightforward, but the thing I struggled with the most was creating the text file for the outputted results. Once I was able to figure that out, the rest is history.

That is all for this class, I can't wait for the next one!

Thanks for reading!

Wednesday, June 19, 2024

Exploring & Manipulating Data - GIS Programming Module 5

 Hello everyone!


This week's lab seemed to be a doozy, it was definitely a bit more complicated. Luckily I was able to work through it and reach the desired outcome. For this week's lab we were expected to be able to work with search cursors and work with lists and dictionaries. We were also expected to check for, describe, and list data, then be able to demonstrate the correct usage of update and insert cursors. Once we did that, we then had to validate table and field names then design a logical model of script using a flow chart. This flow chart demonstrates the flow of the code I wrote and then here are the result:


Here is the outcome:


The first bit of the code is meant to create a new file geodatabase for the lab data. We are doing this so that we make a copy of the data in our database to then pull from later in the code. The CopyFeatures_management line is what copies the data to your newly created database. The next thing we need to do was to make query of our cities shapefile the displays the name of the city, the feature type and population for cities that are county seats. This was done by first identifying the fields I need to use for displaying the data, then create an empty dictionary that will be populated by these fields. After the dictionary was created, I need to write a with, as: statement that setup the Search cursor. This is what populated the dictionary which I then printed to reach the results above.

This weeks lab was a little difficult for me due to the timing of the assignment with a work trip, but I believe I was able to complete it successfully.

Thanks for reading!


Wednesday, June 12, 2024

Geoprocessing - GIS Programming Module 4


This image defines the excitement I had for this week's assignment. 

For this week's assignment, we began exploring geoprocessing, more specifically conducting geoprocessing utilizing ESRI's model builder and writing out Python code. The learning outcomes expected from this assignment were being able to create and modify scripts, creating a script tool using Modelbuilder, using Python 3 to perform multiple geoprocessing tasks, and knowing how to share toolboxes.

Being able to write a script and performing multiple tasks at once is definitely a skill set I want to utilize in my job, that is why I was so excited for this week's assignment because I am now learning ways of making my life easier. The script we had to write this week was definitely a big stepping stone in that direction for me. To successfully write the script the code had to first add XY coordinates to a hospital's shapefile, and then print text saying that the process of adding the coordinates is occurring. After the XY coordinates are added we next need to have the code process a buffer analysis of 1000 meters around each hospital point. But at the same time as the buffer, we need to dissolve the buffer into one polygon which allows for a cleaner display of the 1000-meter buffer around the hospitals. After the buffer analysis with the dissolved buffers is concluded another message should display saying that the process underwent a buffer analysis and the corresponding start and end time messages.

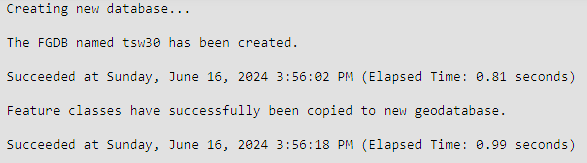
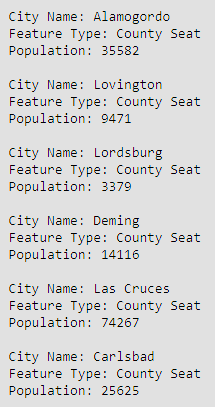
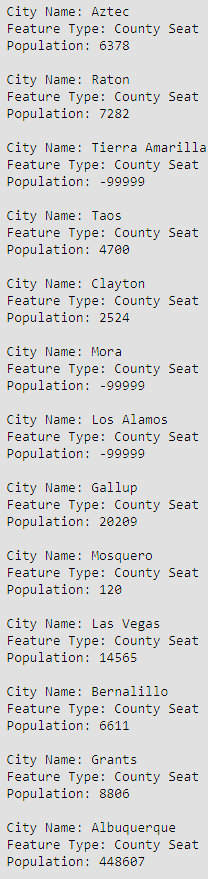
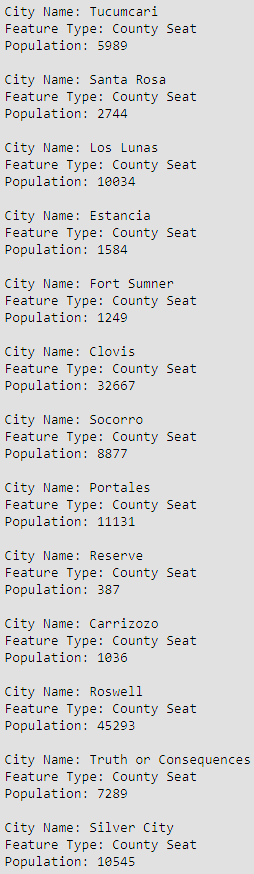
This is what the result of the code should look like:


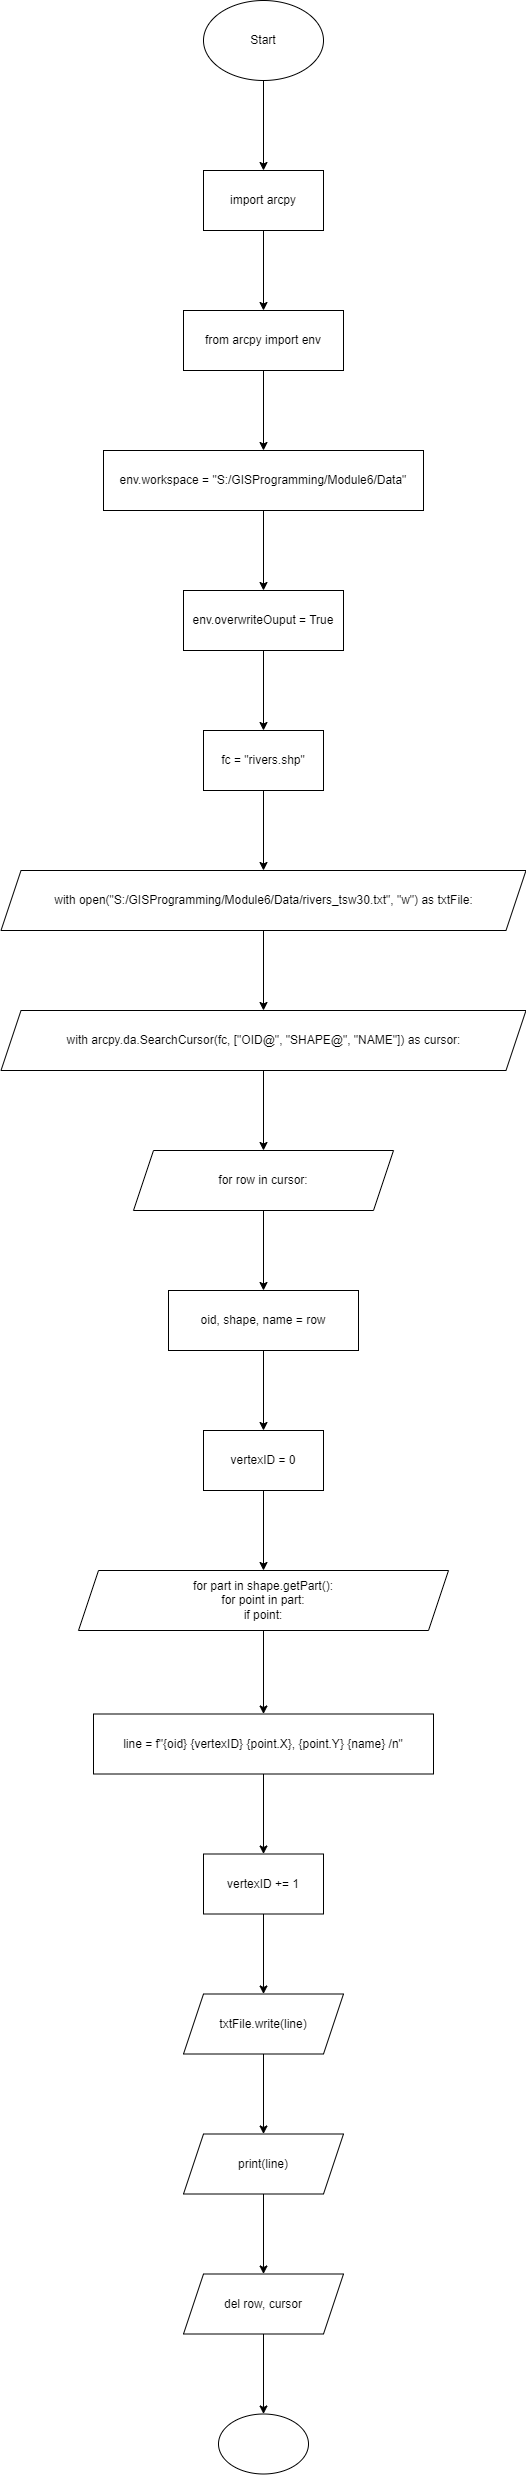
To get to this result, I needed to set my file workspace so that the code knew where to pull the data from and then I needed to set the name of the file being inputted into all of the tools. I then needed to write out the first tool which was the XY coordinates one, it should look something like this: arcpy.AddXY_management(in_features). The in_features is the hospital shapefile, and the only reason why this code was able to be run was because of arcpy being in the front. Arcpy must be included in all cases where geoprocessing tools are utilized. When I wrote my initial code I made it so that the original shapefile wasn't getting the xy coordinates added to it, instead, it was being copied and the copy of the dataset was getting the xy coordinates. That obviously wasn't what the code was meant to do, so I removed that from it. The messages you see below the shapefile image were necessary to include as they showed the process for each tool beginning and ending. Originally, there was no space in between the two different tools being used, to add the space I printed a new line by typing print('\n').
To conduct the buffer analysis and the dissolve tool the code needed to look like this: arcpy.Buffer_analysis('hospitals.shp', 'S:/GISProgramming/Module4/Results/hospitals_buffer.shp', '1000 METERS', '','', 'ALL'). The first comma section is the input feature, the second section is where the resulting buffer will be outputted and the name of the buffer shapefile, and the third section is the buffer distance parameters. Now if I wanted to do just a simple buffer analysis I would be done, but I also needed to dissolve the buffer into one polygon. The assignment did not specify any parameters for the dissolved buffer, the only thing that needed to be specified was that all of the buffers created needed to be dissolved. If you look at the code above after the '1000 METERS' section, that is where the dissolve begins. All you would need to type with the default parameters is: , '', '', 'ALL') and that will get you the dissolved outcome you are looking for.

This week's assignment gave me so many ideas to begin automating and building models for my job, this is the main reason I took this class. With these new skills, I know I will be able to further my career.

Thanks for reading!


Wednesday, June 5, 2024

Debugging and Error Handling - GIS Programming Module 3

 Hello everyone!

In this week's lab, we explored debugging and error handling in Python. I was shocked by how easy this came to me as a beginner, and I was able to look for the errors and implement the solutions easily. As a result, I was able to achieve the learning outcomes for the lab. The first objective we needed to reach was to demonstrate our ability to fix syntax errors and exceptions. We explored this within the scripts we needed to edit. The next outcome we were expected to learn was how to implement debugging procedures and modify scripts to run with exceptions. The third script we edited required us to add an exception to our code by using a try-except statement. Correctly using a try-except statement was one of the objectives we were expected to learn about. We also needed to know how to properly interpret script error messages, because if we don't know how to do that then how can we fix the errors we encounter. Finally, we need to be able to design a logical model of a script using a flowchart.

For the first script, we encountered two errors that needed to be fixed. The first error was a result of case sensitivity as a part of the script was properly capitalized. The next error was an issue with a for-in statement being flip-flopped. The variable had identified fields = arcpy.ListFields(FC), but the for-in statement said for fields in field. This wouldn't work because field had not been identified, so the correct statement would be for field in fields. The resulting code would print this:


The second script included server more errors, mainly in the variable section. The first error was the file path variable being wrong, so I had to ensure that the file path properly matched my project folder. The lab script originally had the file path as S:/GISProgramming/Module3/Results/Austin_TX.aprx when in actuality it is supposed to be S:\GISProgramming\Module3\Data\TravisCountyAustinTX.aprx. The next issue was a simple case-sensitive issue that had to be changed from upper case to lower case. After this issue, another issue that needed to be corrected was a file path using both forward slash and backslash. To fix it you need to be consistent with your slash choice so I went with a backslash. The last three errors were just spelling mistakes that missed a character or two that prevented the code from running properly. Once all of these errors were corrected the resulting code should look like this:

The third and final script required us to NOT fix the errors that occurred when running the script. The objective of this script was to add a try-except statement. I at first didn't read the instructions of the lab and fixed the errors but then realized I had done it wrong. It was pretty straightforward as I had to add the try: statement at the beginning but not before the import statement. After you type the try: statement you let the code for Part A run and once it reaches the end when the error occurs you add the except statement by typing it as Except TypeError:. TypeError is the error that occurred not allowing the code to run. Here is the steps taken in the flowchart on how the code is supposed to properly run:

Now that you know how the code is supposed to run, here is the expected results to know that the code ran properly: 


I really enjoyed this lab and I am very proud of how easily I can recognize the errors we faced. I am now more confident in my ability to be successful in this class and I can't wait to continue learning how to properly code in python.

Thanks for reading!


Final Project and other maps created

 After eight weeks this class has come to its conclusion. Our last task was to come up with a project idea that is geographic and meaningful...